


Bookshelf
Overview of dry bulk shipping
PARTHA SARATHI PAL (GENERAL MANAGER COMMERCIAL)
ISL DUBAI
PREFACE
Right from birth of first human in modern day Africa till the establishment of agricultural society humans had traversed long distance across continents on foot to fight for food, hunger, and water. History of human struggle is endowed with saga of pain, sufferings and demise but human spirit to know and conquer the unseen never stopped.From land to sea to sky and now to space, human always seek vision to explore.
Sea route trade started with early expedition in Europe, moved to medieval Asia before taking huge leap in 14 th century AD. When Portuguese arrived in India in 1457 and found that they could buy pepper for a little money in Calicut and sell them at 25 times price in Europe they were seeing a new dawn – using sea transport to exploit an interregional arbitrage. It was not just a commercial success. By bringing spices to the European population in far greater volumes than could be transported overland by camel, live became better and, in modern economic jargon, ‘added value’. Over the succeeding six centuries, as shipping became more efficient, the opportunities to add value by moving goods around the world increased and sea trade grows giving shipping a central role in the globalization of the world economy. Today 11-billion-ton cargoes move between more than 3,000 +major commercial ports.
Unarguably no form of industry had played such a central part in economic voyages and globalisation over thousands of years. Railways and airlines, shipping’s closest counterpart, had history of barely 150 years.
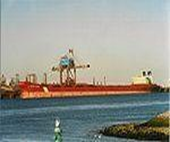
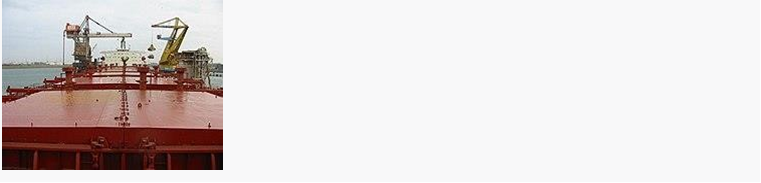
Bulk carrier or bulker is a merchant ship specially designed to transport unpackaged bulk cargo—such as grain, coal, ore, steel coils, and cement—in its cargo holds. Since the first specialized bulk carrier was built in 1852, economic forces have led to increased size and sophistication of these ships. Today's bulk carriers are specially designed to maximize capacity, safety, efficiency, and durability.
Today, bulk carriers make up 21 percent of the world's merchant fleets, and they range in size from single-hold mini-bulk carriers to mammoth ore ships able to carry 400,000 metric tons of deadweight (DWT). Over half of all bulk carriers have Greek, Japanese, or Chinese owners, and more than a quarter are registered in Panama. South Korea is the largest single builder of bulk carriers, and 82 percent of these ships were built in Asia. South Asian countries like India, Pakistan and Bangladesh are top countries for ship recycling when ship has completed cycle of commercial usefulness.
On bulk carriers, crews are involved in operation, management, and maintenance of the vessel, taking care of safety, navigation, maintenance, and cargo care, in accordance with international maritime legislation. Crews can range in size from three people on the smallest ships to over 30 on the largest.
Cargo loading operations vary in complexity, and loading and discharging of cargo can take several days. Bulk carriers can be gearless (dependent upon terminal equipment) or geared (having cranes integral to the vessel).
Before specialized bulk carriers were developed, shippers had two methods to move bulk goods by ship. In the first method, longshoremen loaded the cargo into sacks, stacked the sacks onto pallets,
and put the pallets into the cargo hold with a crane. The second method required the shipper to charter an entire ship and spend time and money to build plywood bins into the holds. To guide the cargo through the small hatches, wooden feeders and shifting boards had to be constructed. These methods were slow and labour-intensive. The problem of efficient loading and unloading has driven the evolution of the bulk carrier.
BULK CARRIER VARIOUS SIZES
Bulk carrier is measured in DWT or Dead weight tonnage. Deadweight is defined as the maximum deadweight of the ship and measure of the ship's carrying capacity. It takes into consideration the weight of the cargo on board, fuel, ballast water, fresh water, crew, provisions for the crew, excluding the weight of the ship in the calculation.
Bulk carriers are segregated into six major size categories: small, , Handy , Handymax, Panamax, capesize, and very large. Very large bulk and ore carriers fall into the capesize category but are often considered separately. The various sub segments categories are given below.
· Small Handy (10,000-24,999 dwt)
· Mid-size Handy (25,000-34,999 dwt)
· Large Handy (35,000-39,999)
· Cement Carrier (Cement capable)
· Handymax (40,000-49,999 dwt)
· Traditional Supramax vessel (50,000-59,999 dwt)
· Ultramax (60,000-64,999 dwt)
· Traditional Panamax vessel (65,000-78,999 dwt)
· Kamsarmax vessel (79,000-84,999 dwt)
· Post -Panamax vessel (85,000 -99,999 dwt)
· Baby Capesize vessel (100,000-119,999 dwt)
· Standard Capesize vessel (120,000-199,999 dwt)
· Large Capesize vessel (200,000+ dwt)
· Very large ore carrier (Vloc) (220, 000+ dwt)
Mini-bulk carriers are prevalent in the category of small vessels with a capacity of under 10,000 DWT. Mini-bulk carriers carry from 500 to 2,500 tons, have a single hold, and are designed for river transport. They are often built to be able to pass under bridges and have small crews of three to eight people.
Handy-size and Handymax ships are general purpose in nature. These two segments represent 55 % of all bulk carriers over 20,000 DWT . Handymax ships are typically 150–200 m in length and between 40000 DWT – 49,000 DWT with five cargo holds and four cranes. These ships are also general purpose in nature. They fill the role of flexible workhorses in trades where parcel size and draft restrictions demand small ships. Typically, they carry minor bulks and smaller parcels of major bulks such as grain, coal and bauxite and in busy maritime areas such as Asia can often complete two loaded voyages for every ballast voyage. As ports have improved over the last 20 years, a new generation of larger 50,000– 64000 dwt Handy bulkers has emerged, generally referred to as Handymax/ supramax , ultramax bulk carriers. Like the Handy bulkers, these vessels are generally geared.
Panamax bulk carriers of 65,000–100,000 dwt service the trades in coal, grain, bauxite and the larger minor bulk parcels. These medium-sized ships are named Panamax because they can transit the Panama Canal, but vessels at the larger end of the range are too big to do so, at least until the Canal is extended served by bulk carriers of 100,000–300,000 dwt, which are heavily dependent on the iron ore and coal trades.( cape size vessels ) Very large ore carriers and very large bulk carriers are a subset of the capesize category reserved for vessels over 200,000 DWT. Carriers of this size are almost always designed to carry iron ore. Panamax and Cape are generally gearless vessel.
Generally small vessel is flexible but expensive to run, while the large vessels become progressively cheaper but not flexible.
Vessel sizes in maritime trade have increased as a consequence of the need to reduce operating costs by achieving economies of scale. At the beginning of 2006, there were 1,249 bulk carriers attributable to the panamax size segment (60,000-80,000 DWT) now in year 2023 it is around 3170 units in Panamax segment with a share of 26.0 percent of the total bulk tonnage. In 2006 about 796 capesize bulk carriers (greater than 80,000 DWT) were available, while in year 2023 number of cape has increased to 1561 units with a share of 14 % among all bulk vessel.
|
BULK CARRIER VARIOUS TYPES |
|
|
Illustration |
Description |
|
|
Geared bulk carriers are typically in the handysize to handymax size range although there are a small number of geared panamax vessels, like all bulk carriers they feature a series of holds covered by prominent hatch covers. They have cranes, derricks or conveyors that allow them to load or discharge cargo in ports without shore-based equipment. This gives geared bulk carriers flexibility in the cargoes they can carry and the routes they can travel. (Photo: A typical geared handysize bulk carrier.) |
|
|
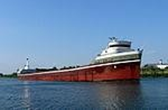
Gearless carriers are bulk carriers without cranes or conveyors. These ships depend on shore-based equipment at their ports of call for loading and discharging. They range across all sizes, the larger bulk carriers (VLOCs) can only dock at the largest ports, some of these are designed with a single port-to-port trade in mind. The use of gearless bulk carriers avoids the costs of installing, operating, and maintaining cranes. |
|
|
Self-dischargers are bulk carriers with conveyor belts, or with the use of an excavator that is fitted on a traverse running over the vessel's entire hatch, and that is able to move sideways as well. This allows them to discharge their cargo quickly and efficiently. |
|
|
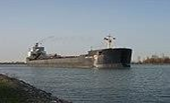
Lakers are the bulk carriers prominent on the Great Lakes, often identifiable by having a forward house that helps in transiting locks. Operating in fresh water, these ships suffer much less corrosion damage and have a much longer lifespan than saltwater ships. |
CEMENT CARRIER
BULK CARRIER OWNERSHIP
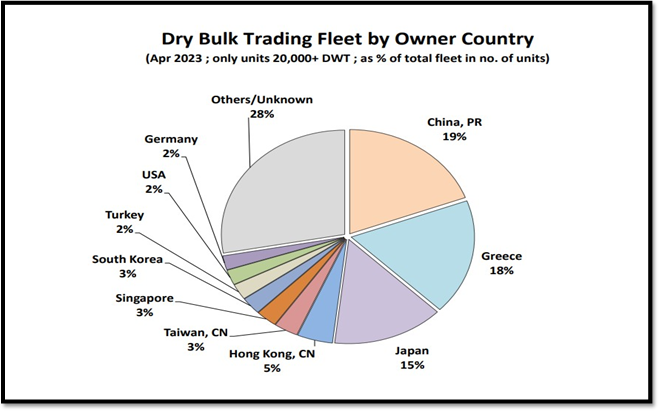
Greece, Japan, and China are the top three owners of bulk carriers. These three nations account for over 53% of the world's fleet.
Several companies have large private bulk carrier fleets. The multinational company Oldendorff Carriers have 750 owned and chartered vessels . Star Bulk carriers and Ultrabulk have 130 and 160 vessels respectively. The Fednav Group in Canada operates a fleet of over 80 bulk carriers, including two designed to work in Arctic ice. Croatia's Atlantska Plovidba d.d. has a fleet of 11 bulk carriers. Norden in Denmark and Eagle Bulk USA are also own notable bulk carrier.
There is a significant growth in earnings for ship owners in Year 2021- 2022 due to elevated dry bulk market. Dry bulk owners have a good time after long time which help in stabilisation / future growth.
INSIDE BULKER

MV TBN Panamax bulk carrier (77,000 dwt), built 2006. Oshima Shipbuilding Co., Japan 77,000
HULL CARGO MACHINERY & EQUIPMENT
Deadweight (summer draft): 77,053 Strengthened for heavy cargoes.
Length, overall (m): 225.0 Cargo capacity of holds auxiliary engines Length between perpendiculars: 225.0 Engine: MAN B&W 5S60MC-C two-stroke Deadweight (winter draft): 75,073 Bale capacity: 89,121 m3 Power max (hp): 12,670@89 rpm (9.32 MW)
Power continuous: 10,135@83 rpm (7.45 MW) Gross Tonnage 43431
Net tonnage (international): 25,482
Maximum speed (knots): 14.5 (15% SM) Fuel consumption: 35 tons/day Dimensions (all in metres) hatch covers side rolling, hydraulic.
Generators: 2 AC generators 475 KVA Overall beam (m): 32.3 Nos 2, 4 and 6 may be empty Ratings, pilot
There are two AC generators driven by diesel engines, an auxiliary boiler and an emergency generator. In addition, the ship has two ballast pumps handling 800 cubic metres an hour and ballast water is carried in the topside tanks, the double bottom and hopper side tanks and a floodable hold for use in heavy weather.
A bulk carrier's design is largely defined by the cargo it will carry. The cargo's density, also known as its stowage factor, is the key factor. Densities for common bulk cargoes vary from 0.6 tons per cubic meter for light grains to 3 tons per cubic meter for iron ore.
For a given tonnage, the second factor which governs the ship's dimensions is the size of the ports and waterways it will travel to. For example, a vessel that will pass the Panama Canal will be limited in its beam and draft. For most designs, the ratio of length-to-width ranges between 5 and 7, with an average of 6.2. The ratio of length-to-height will be between 11 and 12.
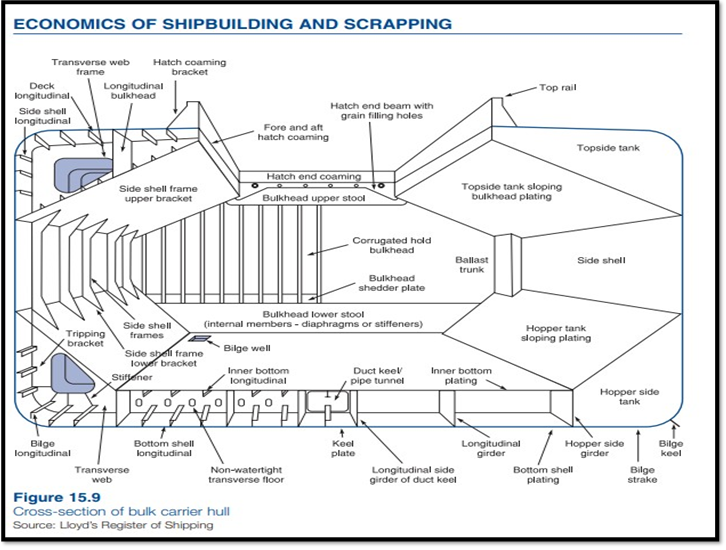
Illustration of typical midship section of a bulk carrier with a single hull and double bottom.

The engine room on a bulk carrier is usually near the stern, under the superstructure. Larger bulk carriers, from Handymax up, usually have a single two-stroke low-speed crosshead diesel engine directly coupled to a fixed-pitch propeller. Electricity is produced by auxiliary generators and/or an alternator coupled to the propeller shaft. On the smaller bulk carriers, one or two four- stroke diesels are used to turn either a fixed or controllable-pitch propeller via a reduction gearbox, which may also incorporate an output for an alternator. The average design ship speed for bulk carriers of Handysize and above is 13.5–15 knots (25.0– 27.8 km/h; 15.5–17.3 mph).
HATCHES
|
|
A hatch or hatchway is the opening at the top of a cargo hold. The mechanical devices which allow hatches to be opened and closed are called hatch cover. In general, hatch covers are between 45% and 60% of the ship's breadth, or beam, and 57% to 67% of the length of the holds.[4] To efficiently load and unload cargo, hatches must be large, but large hatches present structural problems. Hull stress is concentrated around the edges of the hatches, and these areas must be reinforced. Often, hatch areas are reinforced by locally increasing the scantlings or by adding structural members called stiffeners. Both of these options have the undesired effect of adding weight to the ship.
As recently as the 1950s, hatches had wooden covers that would be broken apart and rebuilt by hand, rather than opened and closed. Newer vessels have hydraulic-operated metal hatch covers that can often be operated by one person. Hatch covers can slide forwards, backwards, or to the side, lift up or fold up. It is essential that the hatch covers be watertight: unsealed hatches lead to accidental cargo hold flooding, which has caused many bulk carriers to sink.
The hull of a merchant ship is basically a box built from thin steel plate, reinforced by internal bulkheads and sections to give strength. Within the hull are various items of equipment required to propel and control the ship, handle cargo, accommodate the crew and monitor performance. The complexity in shipbuilding lies in minimizing the materials from various sources and labour required to construct a ship to the structural standards (‘scantlings’) laid down by the classification societies. The way naval architects resolve this problem depends on the ship. The bulk carrier hull shown below uses steel plate to construct the sides, double bottom, sloping plates, bulkheads and shaped components such as the transverse web. Sections are welded to the flat plate, for example as side or bottom shell longitudinals, to give rigidity. Although this structure looks simple, its structure is complex. The main deck is broken up by hatch openings and the hull derives its strength from the double bottom, the hopper tanks, the hatch coamings and the frames which run along the hull. Into the hull are fitted the many components, main engine, auxiliaries, pipe work, control systems, wiring and pumps. The entire structure must be coated with an efficient paint system, offering a long working life with minimum maintenance.
The crew on a bulk carrier typically consists of 20 to 30 people, though smaller ships can be handled by 8. The crew includes the captain or master, the deck department, the engine department, and the steward's department. The practice of
taking passengers aboard cargo ships, once almost universal, is very rare today and almost non-existent on bulk carriers.
Fewer deck officers are employed on bulk carriers than on similarly sized ships of other types. A mini-bulk carrier carries two to three deck officers, while larger Handysize and Capesize bulk carriers carry more crew.
Crew nationality varies from time to time with companies taking people from approximate 400,000 sea farers in cargo ship.
A bulk carrier's voyages are determined by market forces; routes and cargoes often vary. A ship may engage in the grain trade during the harvest season and later move on to carry other cargoes or work on a different route. Aboard a coastal carrier in the tramp trade, the crew will often not know the next port of call until the cargo is fully loaded.
Loading and unloading a bulk carrier is time-consuming and dangerous. The process is planned by the ship's chief mate under the direct and continued supervision of ship's captain. International regulations require that the captain and terminal master agree on a detailed plan before operations begin. Deck officers and stevedores oversee the operations.
The loading method used depends on both the cargo and the equipment available on the ship and on the dock. In the least advanced ports, cargo can be loaded with shovels or bags poured from the hatch cover. This system is now adays being replaced with faster, less labor-intensive methods like shore-based gantry cranes, reaching 2,000 tons per hour. A crane's discharge rate is limited by the bucket's / grab capacity (from 6 to 40 tons) and by the speed at which the crane can take a load.Conveyor belts offer a very efficient method of loading, with standard loading rates varying between 100 and 700 tons per hour, although the most advanced ports can offer rates of 30000-40000 tons per hour ( Nacala in Mozambique / Richards Bay / Australian coal ports etc ).
Stability of ship is very important as ship has to traverse long distance and face varying external environment.
Few issues concerning stability are discussed.
Cargo shifting poses a great danger for bulk carriers. The problem is even more pronounced with grain cargoes, since grain settles during a voyage and creates extra space between the top of the cargo and the top of the hold. Cargo is then free to move from one side of the ship to the other as the ship rolls. This can cause the ship to list, which, in turn, causes more cargo to shift. This kind of chain reaction can capsize a bulk carrier very quickly. The 1960 SOLAS Convention sought to control this sort of problem. These regulations required the upper ballast tanks designed in a manner to prevent shifting. They also required cargoes to be levelled, or trimmed, using excavators in the holds. The practice of trimming reduces the amount of the cargo's surface area in contact with air which has a useful side-effect: reducing the chances of spontaneous combustion in cargoes such as coal, iron, and metal shavings.
Reinforcement For stability The new rules adopted in the 1997 annexes to the SOLAS convention focused on problems such as reinforcing bulkheads and the longitudinal frame, more stringent inspections (with a particular focus on corrosion) and routine in- port inspections. The 1997 additions also required bulk carriers with restrictions (for instance, forbidden from carrying certain types of cargoes) to mark their hulls with large, easy-to-see triangles.
Moisture Another sort of risk that can affect dry cargoes is absorption of ambient moisture. When very fine concretes and aggregates mix with water, the mud created at the bottom of the hold shifts easily and can produce a free surface effect. The only way to control these risks is by good ventilation practices and careful monitoring for the presence of water. Cement or other hygroscopic cargo is susceptible to it.
TITLE-2. SHIPPING MARKET AND VARIABLES
Shipping is part of international business and carries 95 pct of world merchandise trade. It is very cyclical business and closely follows VUCA (Volatility. uncertainty, complexity and ambiguity). Shipping resembles fast changing pattern of commodity and financial currency.
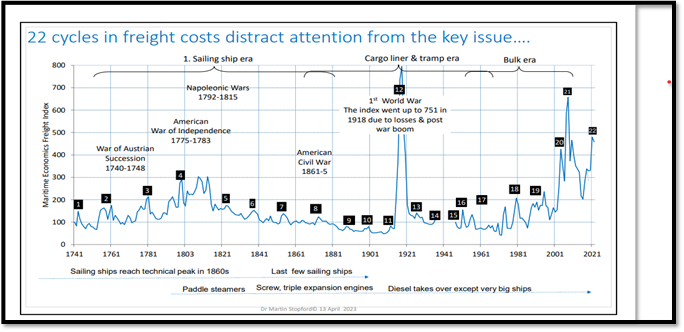
There were number of freight cycles in last three centuries coming in various forms of dry bulk shipping evolution.
Shipping is the derived commodity which is driven by supply and demand.
Accordingly shipping history identify five key demand variables: World economy, commodity trades, average haul, political events and transport costs. All these are explained here.
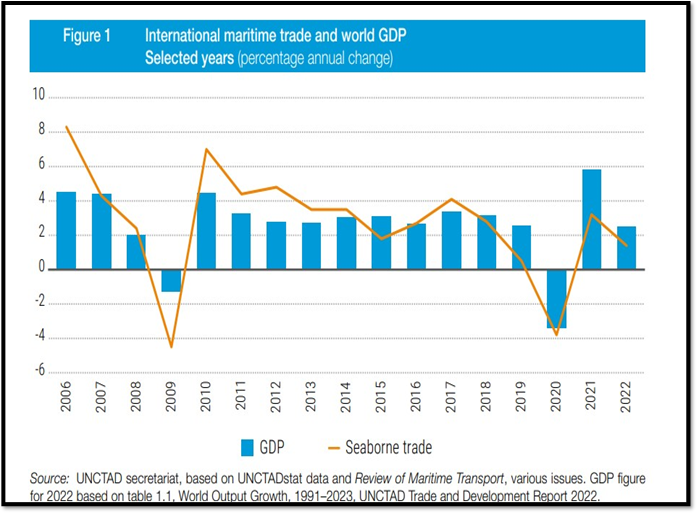
World economy - FIRST DEMAND VARIABLE
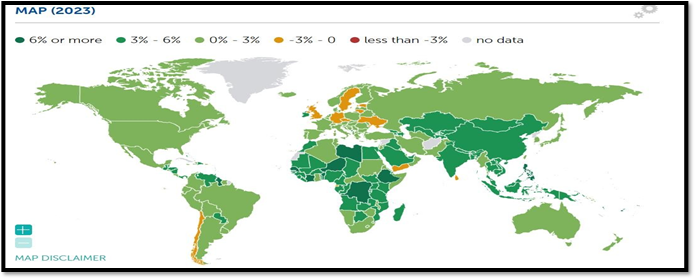
The demand for ships starts with the world economy. A comparative economic growth in various regions currently is shown here.
Seaborne trade has a central place in our lives in the twenty-first century. We see that much of what we see in shop have originated from overseas. Between 1950 and 2005 sea trade grew from 0.55 billion tons to 7.2 billion tons, an average of 4.8% per annum which has now moved to 11 billion tonnes in 2023 This expansion was the result of the most fundamental redesign of the world’s political and economic arrangements since the industrial revolution. The rapid economic growth and increasing consumer wealth which drove this change were initiated at the Bretton Woods conference in 1944 which established the economic foundations for a period of economic stability which allowed companies and investors to operate freely across the globe. Three important developments helped: ● The world was progressively opened to free trade. The European empires were dismantled in the 1950s, removing a network of bilateral trade preferences, the opening of the Chinese economy to free trade in the mid-1990s till today.
Growth of maritime trade in last 40 years
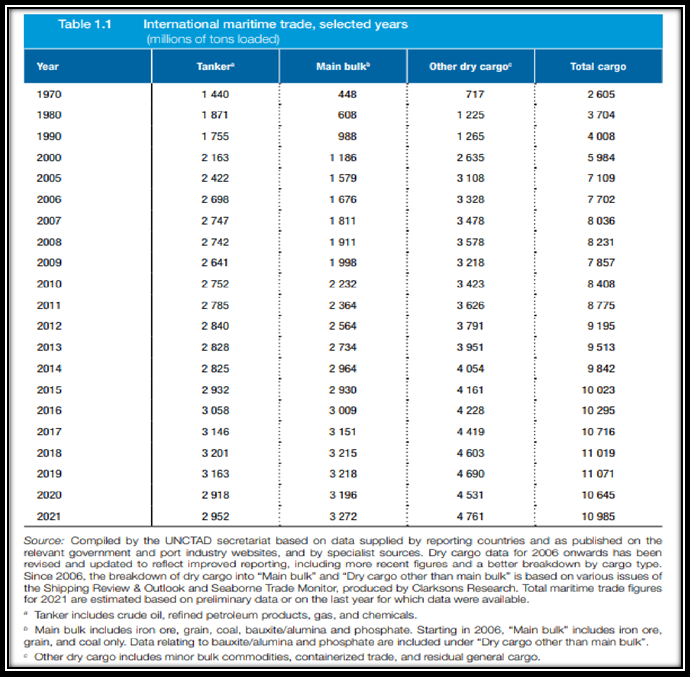
Maritime trade gave access to world markets, making economic development possible. With the associated improvements in inland transport infrastructure, the catchment area for trade widened with each decade. The Principles of Maritime Trade A kingdom, that has a large import and export, must abound more with industry, and that employed upon delicacies and luxuries, than a kingdom that rests contented with its native commodities. It is, therefore, more powerful as well as richer and happier. Along with trade, big business house was able to shop around the world for components, raw materials and new markets. In doing so they brought new countries into the global system, generating new trade growth and giving rise to the trade system. Raw materials are shipped by sea to processing plants, often near the markets; They are fed to the assembly plants, and then it is transferred to the wholesalers and retailers. As sea transport costs fell, new opportunities for manufacturing were opened up, often involving multiple sea voyages. For example, high-technology components are shipped to an assembler in a low-cost economy, processed, then exported as finished goods. This type of classic trade arbitraging is made possible by the transport network. In this expanding global economy sea trade grew in pace with the world economy. For example, between 1986 and 2005 sea trade grew at an average of just over 3.6% per annum, very slightly faster than the growth of world GDP, which averaged just under 3.6% per annum. But when we dig deeper and look at the individual commodities shown we find that the rate of growth varied enormously. The phosphate rock trade declined, whilst coking coal grew at less than 2% per annum. A few new trades such as steam coal appeared and others such as asbestos disappeared. Containerized cargo grew at 9.8% per annum. Regional trade was also constantly on the move. Two of the biggest trading regions, western Europe and Japan, went through a cycle of growth until the early 1970s and stagnation for the next decade. New high growth economies emerged in other areas, notably in Asia and North America. With China’s entry in WTO in year 2001 shipping got the extra momentum in 21st century.
Tentative signs in early 2023 that the world economy could achieve a soft landing—with inflation coming down and growth steady—have receded amid stubbornly high inflation and recent financial sector turmoil. Although inflation has declined as central banks have raised interest rates and food and energy prices have come down, underlying price pressures are proving sticky, with labor markets tight in a number of economies. Side effects from the fast rise in policy rates are becoming apparent, as banking sector vulnerabilities have come into focus and fears of contagion have risen across the broader financial sector, including nonbank financial institutions. Policymakers have taken forceful actions to stabilize the banking system. As discussed in depth in the Global Financial Stability Report, financial conditions are fluctuating with the shifts in sentiment. In parallel, the other major forces that shaped the world economy in 2022 seem set to continue into this year, but with changed intensities. Debt levels remain high, limiting the ability of fiscal policymakers to respond to new challenges. Commodity prices that rose sharply following conflict in black sea have moderated, but the war continues, and geopolitical tensions are high. Infectious COVID-19 strains caused widespread outbreaks last year, but economies that were hit hard—most notably China—appear to be recovering, easing supply- chain disruptions. Despite the fillips from lower food and energy prices and improved supply-chain functioning, risks are firmly to the downside with the increased uncertainty from the recent financial sector turmoil. The baseline forecast, which assumes that the recent financial sector stresses are contained, is for growth to fall from 3.4 percent in 2022 to 2.8 percent in 2023, before rising slowly and settling at 3.0 percent five years out––the lowest medium-term forecast in decades. Advanced economies are expected to see an especially pronounced growth slowdown, from 2.7 percent in 2022 to 1.3 percent in 2023.
In a plausible alternative scenario with further financial sector stress, global growth declines to about 2.5 percent in 2023––the weakest growth since the global downturn of 2001, barring the initial COVID-19 crisis in 2020 and during the global financial crisis in 2009––with advanced economy growth falling below 1 percent. The anaemic outlook reflects the tight policy stances needed to bring down inflation, the fallout from the recent deterioration in financial conditions, black sea conflict, and growing geoeconomic fragmentation. Global headline inflation is set to fall from 8.7 percent in 2022 to 7.0 percent in 2023 on the back of lower commodity prices but underlying (core) inflation is likely to decline more slowly. Inflation’s return to target is unlikely before 2025 in most cases. Once inflation rates are back to targets, deeper structural drivers will likely reduce interest rates toward their pre-pandemic levels (Chapter 2). Risks to the outlook are heavily skewed to the downside, with the chances of a hard landing having risen sharply. Financial sector stress could amplify, and contagion could take hold, weakening the real economy through a sharp deterioration in financing conditions and compelling central banks to reconsider their policy paths.
(II) Structure of the commodity trades is SECOND DEMAND VARIABLE
We can closely follow the changes in trade demand in recent years.
Total Maritime trade and variance as of Dec 2022
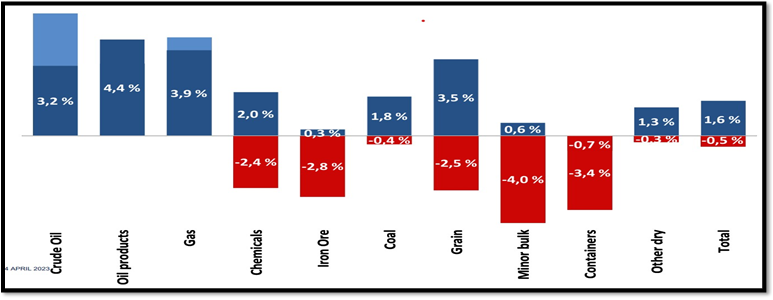
Total dry bulk trade and variance in shipping demand (commodity wise)
(iii) Distance (average haul) is the THIRD DEMAND VARIABLE and here again we found that there have been substantial changes in the past. They are measured in Ton miles. More the average tonnes of ship ton mile go up. Sometimes change in trade due to various reasons also affect to mile distance The iron ore which is covering longer distance from Brazil in bigger cape size vessel has larger impact in tonne miles than coal hauled in short distance from Indonesia to South China in supramax vessel.
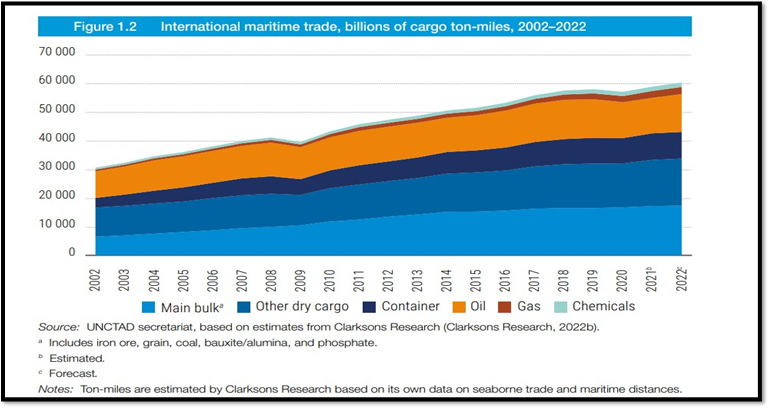
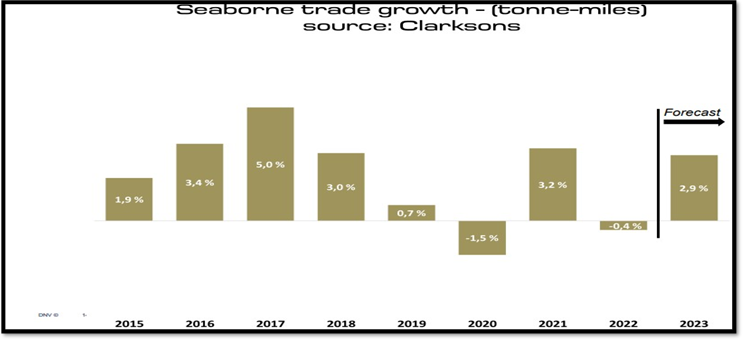
In 2020, according to CLARKSONS Research, total ton-miles fell by 1.5 per cent but in 2021 increased by 3.2 per cent, to 58,988 billion. Growth would have been stronger without recurring waves of COVID-19 and a logistics crunch. Broken global supply chains, with imbalances in demand and supply, created global manufacturing bottlenecks resulting in many shortages, notably for semiconductors and computer chips, with serious ramifications. In year 2023 tonne mile is expected to pick up.
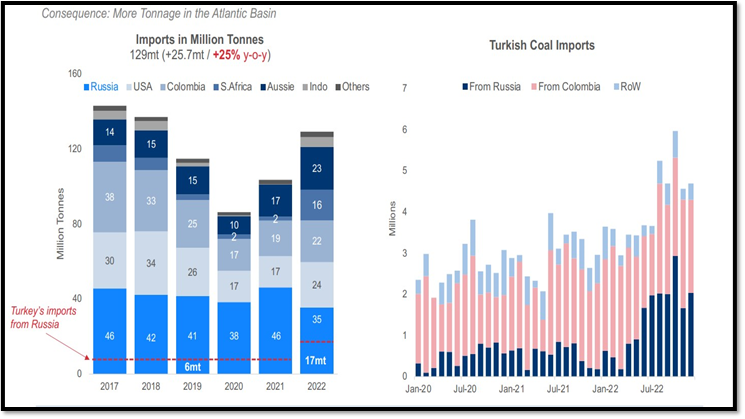
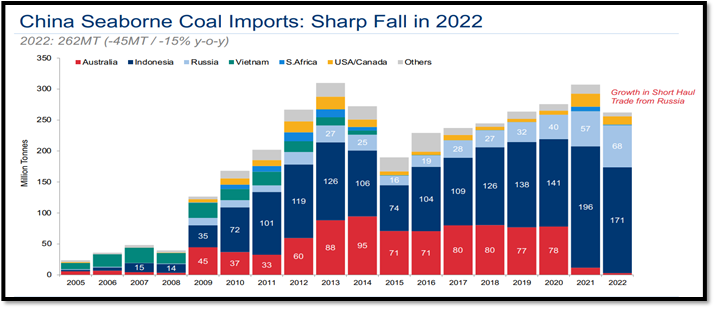
( IV ) Political event is the FOURTH DEMAND VARIABLE, since war and disturbances often have repercussions for trade.
a) Change in trade pattern was observed recently after start of conflict in European region in year 2022. Turkey imported more coal from Russia. It rose from 6 MT in 2019 to 17 MT in year 2022. There was a huge increase in import of coal in Atlantic so that coal import to Europe rose by 25 percentage.
b) After the onset of Black Sea conflict on 24 February 2022, weekly departures of ships from Ukraine’s ports immediately dropped from 160 to around 10 (figure 4.23). They marginally recovered to about 30 by April and after the signing of the Black Sea Grain Initiative (BSGI) in July increased to around 100 but were still about 35 per cent below the pre-war period in September.31 Departures from Black Sea ports in the Russian Federation also declined, from 280 to around 150, though by April had recovered to 250. Port calls in Türkiye dropped from 700–800 to 600, though by May had recovered to 700–800; since then, for most weeks, they have been around the corresponding week of 2021. Some cargoes are transported from Ukraine to Romania by road, rail or barge, and then shipped from Romanian ports, particularly Constanta. As a result, Romania’s port calls increased from around 100 to 120–140.32 Given the ensuing congestion in Constanta, ports in Bulgaria have become a viable option for Ukrainian exporters and importers.33 Other Carriers from Ukraine turned to safer trade routes along the Danube River, departing from river ports such as Reni and Izmail. Following the signing of the BSGI (Black Sea green Initiative) more dry bulk carriers departed from major Black Sea ports – Chornomorsk, Odessa, and Pivdennyi/Yuzhny. There can be possible alteration of trade routes depending on BSGI renewal scheduled in this month.

c) a) After the conflict in Europe China has increased its dependence on Russian coal. This has altered tonne mile demand.
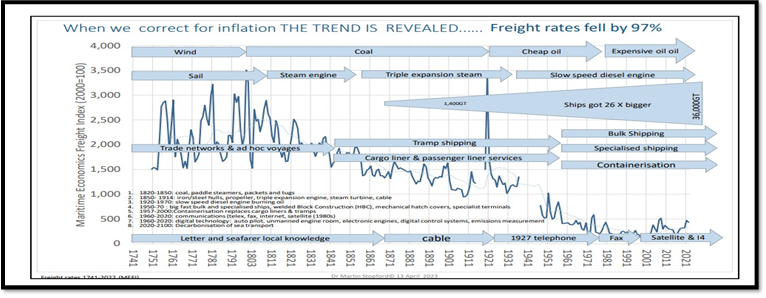
(V) Transport costs is FIFTH DEMAND VARIABLE determining the long-term demand.
Globally shipping has contributed to reduction of transport cost in last three centuries and that is why it is still the preferred mode of transport internationally compared to other modes. An illustration is given below – bulk shipping freight has dropped by 97 pct when we adjust against Inflation . This has helped in increasing the demand to 11 billion tons as on today.
Even in modern times short haul costal trade / ferry trade is replacing road transport due to reduction in transport cost . Illustration is given here to show how Indian coastal trade is growing due to cost advantage over shipper and buyer compared to road transport . The various origin and destination point are marked here in Indian coastal water.
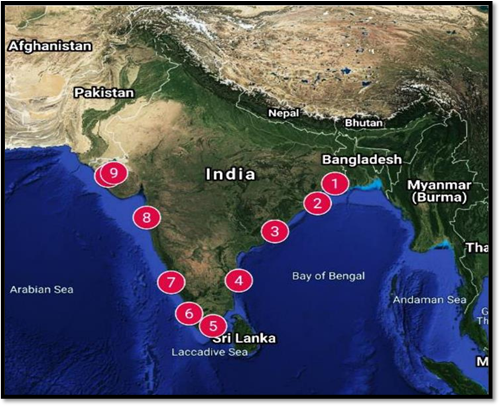
It says waterways are the most fuel-efficient and cost-effective mode of transport. Various estimates suggests that In India Waterways cost around Rs 1.1 – 1.2, railways cost Rs 1.2 – 1.5 and roadways cost Rs 2-3 to transport 1 tonne of freight over 1 km. India’s uneven logistics modal mix is dominated by roads, which handle about 60-65 per cent of India’s freight movement, followed by railways (around 30 per cent), waterways (around 6 per cent) and air (1-2 per cent). Multimodal shift to waterways, utilizing 7,500 km of coastline and 14,000 km of inland water ways can lead to lower transportation costs, environmental impact, economic growth of the nation. Sagarmala, an India Govt Initiative targets to double the waterways share in the modal mix from 6 per cent to 12 per cent by 2025 leading to more demand compared to road and rail.
World fleet - FIRST SUPPLY VARIABLE
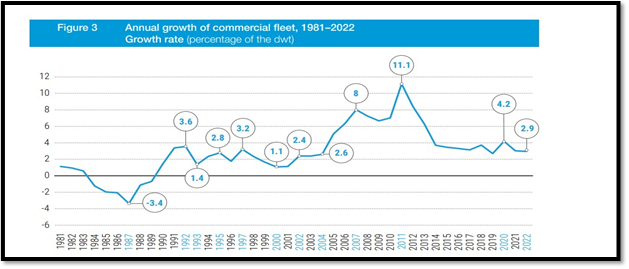
The size of the world fleet is controlled by shipowners who respond to the freight rates by scrapping, newbuilding and adjusting the performance of the fleet. Because the variables in this part of the model are behavioural, the relationships are not always predictable. Market turning points depend crucially on how owners manage supply. Although the orderbook provides a guide to the size of the world fleet 12–18 months ahead, future ordering and scrapping are influenced by market sentiment, and are very unpredictable. Freight rates link supply and demand. When supply is tight freight rates rise, stimulating shipowners to provide more transport. When they fall, it has the opposite effect. We looked in detail at the dynamics of the mechanism by which freight rates are determined and found that timescale is important in reaching an equilibrium price. Momentary equilibrium describes the day-to-day position as ‘prompt’ ships in a particular loading area compete for the available cargoes. Short-run equilibrium describes what happens when ships have time to move around the world, adjust their operating speed or spend time in lay-up. In shipping the long-term is set by the time taken to deliver new ships – say, 2–3 years. This characteristic certainly influences the 7–8 year duration of freight cycle.
b) Productivity- SECOND SUPPLY VARIABLE
Productivity depends on availability of ships and how the ships are available during this time. There is huge increase in productivity in speed / DWT / consumption in last 100 years but supply side factors like congestion can affect productivity . Some illustrations are given below.
1) Congestion
Congestion in port creates artificial scarcity of vessel hampering productivity. During peak covid time (FY 2021/22) there were lot of delays due to protection / protocol / regulations in various countries / ports which lead to build up of traffic in port . This led to artificial scarcity in market and increase in hire market.
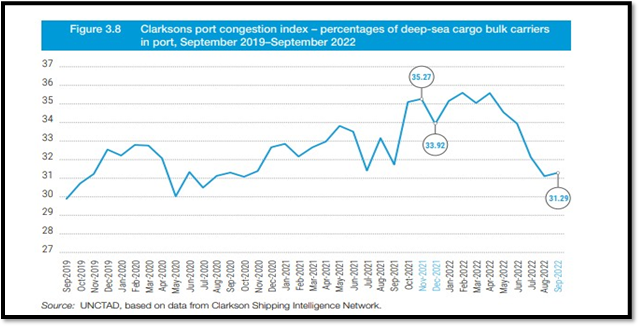
A sharp drop in port delays, set against the backdrop of weak trade demand, was the key factor behind the swift retreat in dry bulk freight rates seen in the second half of 2022. The decline was broad-based and counter-seasonal, with spot rates falling by an average of 30% compared to 21H2, leaving them down by roughly half compared to the year-earlier level. Bulker secondhand values fell more modestly, down an average of 15% in the second half of 2022, and they finished the year down 5-10% compared to their end-2021 levels.
Covid-related port delays were a key driver of the dry bulk market boom that lasted from early 2021 to mid-2022. During this period, we saw time spent in ports increase to a peak above 18.5 days per roundtrip voyage, up from a pre-Covid level of around 15 days. This contributed to a 7% decline in fleet productivity from 2019 through the middle of 2022, which was the main factor behind fleet utilization rising to an 11 year high in late 2021.
But time spent in ports fell back to just 16 days in the final quarter of 2022, leaving them just one day above the pre-Covid level. This led to a 3% increase in fleet productivity compared to the first half of 2022, which was more than the market could bear, especially given the weakness in trade demand. We estimate that global dry bulk trade fell by nearly 1% in 2022, with the iron ore trade seeing the biggest drop, as global steel production fell by 4% last year. Preliminary estimates also point to a decline in the grain and minor bulk trades last year. Although the global steam coal trade increased modestly in 2022, helped by a war-related increase in longer-haul European imports, that was insufficient to offset the declines in other trades.
While the impact of falling port delays has already played a significant role in bringing the dry bulk market back to earth, we expect delays to fall further over the next 12 months or so, helped by a decline in Covid-related delays and a corresponding easing of logistics disruptions.
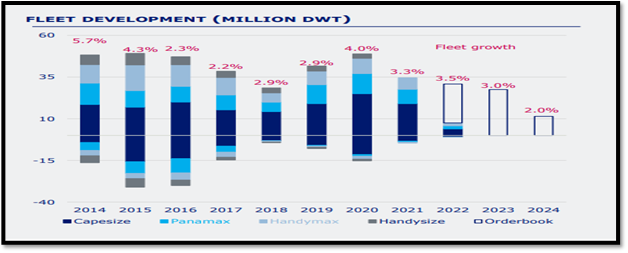
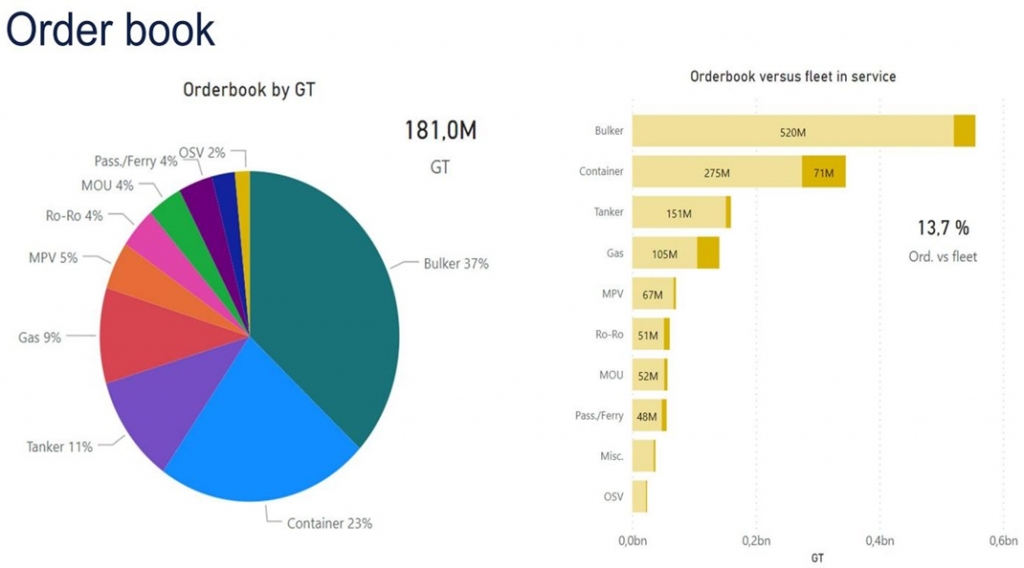
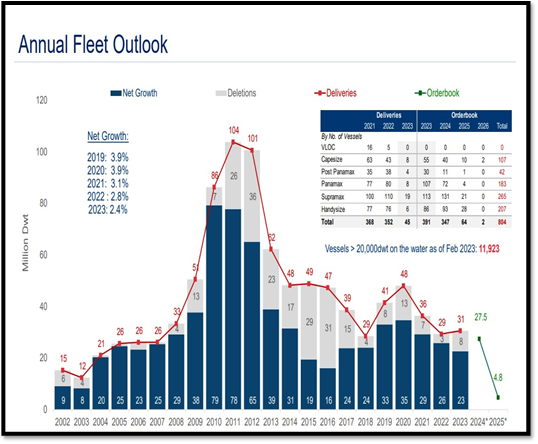
2) Shipbuilding ordering / delivery THIRD SUPPLY VARIABLE impacts the supply. More ordering without cancellation leads to more vessel supply. Currently order book is low as evident from following illustration. This will may help in stabilising the supply as against overordering.
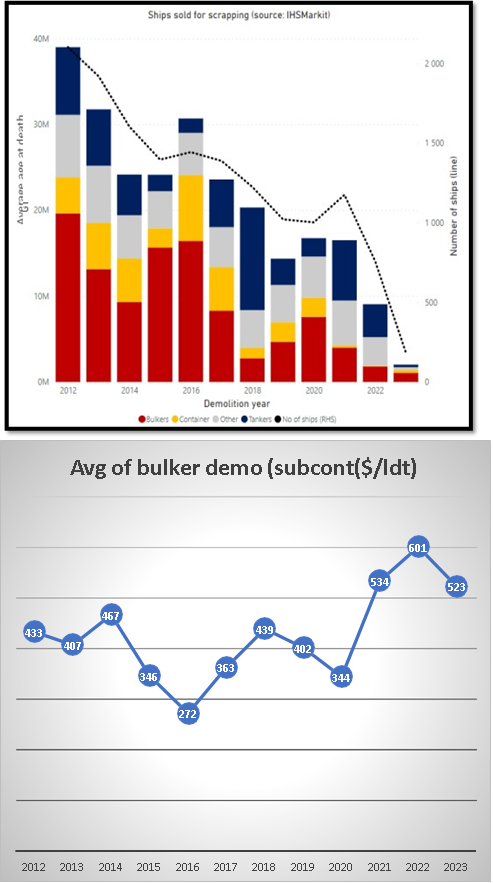
1) Scrapping is 4 TH SUPPLY VARIABLE
Generally, ships are removed from the fleet by going through a process known as ship breaking or scrapping. Ship- owners and buyers negotiate scrap prices based on factors such as the ship's empty weight (called light ton displacement or LDT) and prices in the scrap metal market. Various ships are scrapped in places like Alang, India and Chittagong, Bangladesh. This is often done by 'beaching' the ship on open sand, then cutting it apart by hand with gas torches, a dangerous operation that results in injuries and fatalities, as well as exposure to toxic materials such as asbestos, lead, and various chemicals.
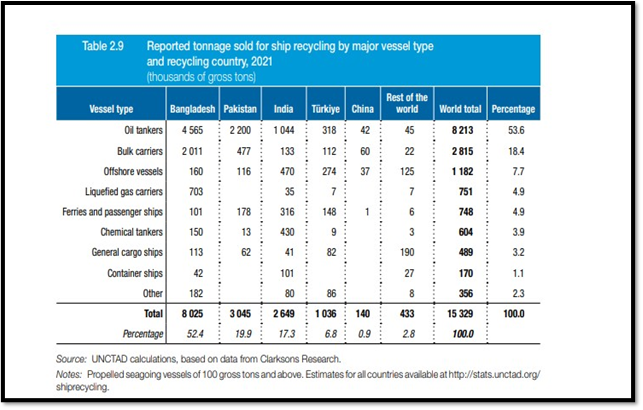
In 2021, more than half the world’s recycling by tonnage was in Bangladesh which, with Pakistan, India and Türkiye, accounted for 96 per cent of ship recycling (table 2.9). In the 12 months to January 2022, recycling volumes declined by 11 per cent, from 17,207,838 to 15,328,713 GT. Although this decline was mostly due to strong markets that encouraged owners to retain vessels, there were also other factors such as limits on imports of vessels (Bangladesh and Pakistan) on letters of credit to protect foreign reserves (Bangladesh),39 as well as COVID restrictions. recycling increased most for chemical tankers, by 143 per cent, and for oil tankers, by 331 per cent which accounted for more than half of the recycled volumes. Owners of other vessel types were more likely to hang on to their existing tonnage in view of potential profitability. As a result, recycling declined by volume for container ships by 92 per cent and for bulk carriers by 70 per cent.
2022 was the year when shipping scrapping was lowest as market was high for bulker vessel.
Scrapping also depends on age and utility of vessel. More vessel becomes older and if market is not favourable, scrapping increases.
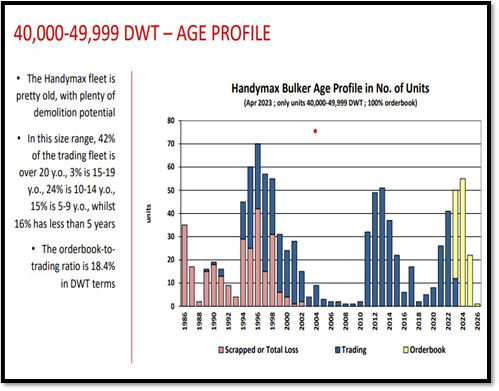
Although bulker fleet +20000 is relatively young, there is enough scope for scrapping in Handymax between 40 k -49 k dwt
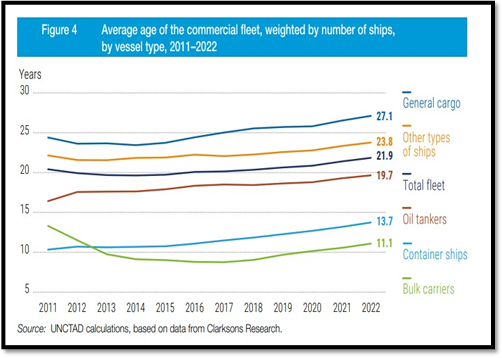
Average ship age has been increasing partly because, in the dry bulk sector especially, shipowners have been uncertain about future technological developments and the most cost-efficient fuels, as well as about changing regulations and carbon prices. To benefit from the current high freight and charter rates, they have therefore kept their older ships in operation. The scrap price is also deciding factor as shown below.
1) Freight rates 5 TH SUPPLY VARIABLE
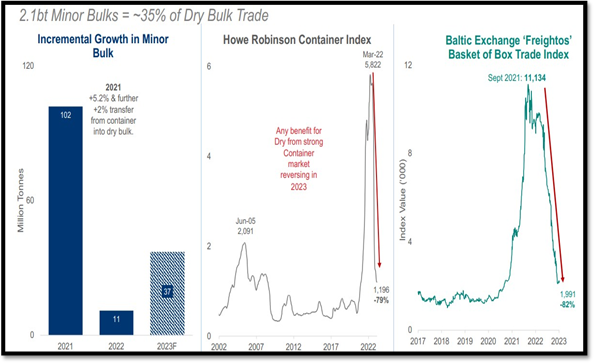
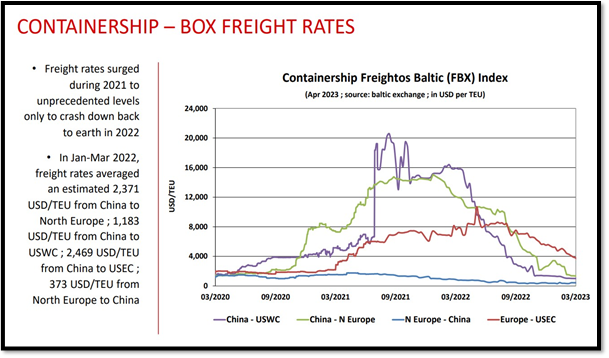
Freight rates in various segments affect supply. When freight rate goes up vessel go for business paying more hire, creating artificial shortage in vessel supply .Even change in freight rate in allied segment like container can shift in vessel supply . In 2021 due to high container rate lot of bulk vessel supply got depleted as containerised cargo was converted into break bulk cargo, otherwise utilised for other dry cargo. But once container rate goes done (please refer graph below) customers again start shifting leading to more supply in geared handy dry bulk vessel.

UPPLY AND DEMAND – INTERPLAY
DEMAND FACTORS
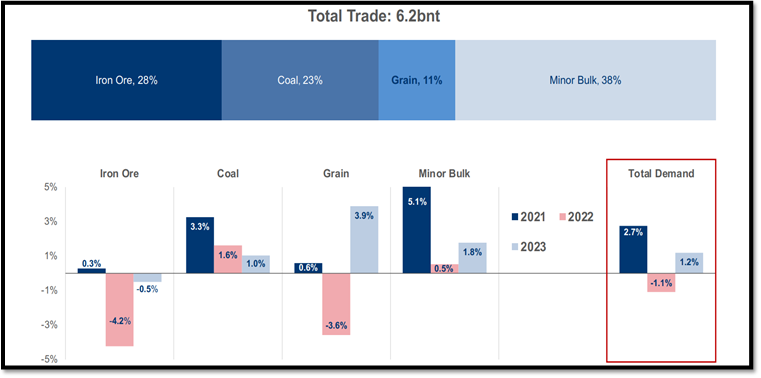
MAJOR DRY BULK TRADES
Major dry bulks are building blocks for modern society. Iron ore and coking coal are the raw materials of steelmaking, and steel is the principal material used in the construction of industrial and domestic buildings, motor cars, merchant ships, machinery and the great majority of industry products. Steam coal is a major energy source for power generation. The staple foods of the modern industrial society are bread and meat, both of which require large quantities of grain – for baking and as the raw material of the modern factory farming Because of their volume, the three major bulk trades are the driving force behind the dry bulk carrier market. In 2005 the trade totalled 1.58 bt, accounting for almost one quarter of total seaborne cargo, and in terms of tonnage about the same as the crude oil trade. But in 2023 dry bulk accounted for about 6 billion ton out of 11-billion-ton maritime trade which means a significant share of 55 pct in the pie. Tonnage of cargo in each commodity and its growth rate in each of the last four decades are shown in Over the four decades 1965–2023 the major bulk trades grew but each followed a different growth pattern. Coal grew much the fastest (6.3% pa), followed by iron ore (3.7% pa) and grain (3.1% pa). In addition, the table shows that the rate of growth varied from decade to decade. For example, iron ore grew at 7% pa in the first decade, and 1–2% pa in next two, and 5% in the last. In year between 2010 – 2023, soyabean / corn (grain ) , Bauxite and other dry cargo has a faster growth rate with some of taking share from container in year 2021- 2022 period. As we can see below there is no simple pattern. Each commodity has its own distinctive industrial characteristics, growth trends and impact upon the dry bulk shipping industry.
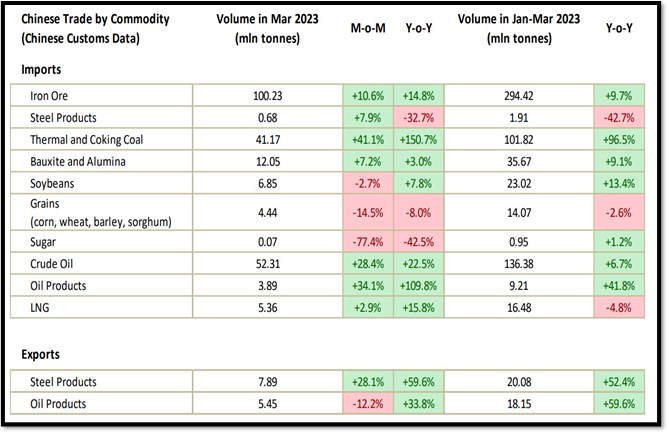
Three main pillars Coal, Iron ore, agri products is the backbone of dry bulk shipping and as in commodity their rate also changes weekly / monthly / yearly depending on demand and supply . A snapshot of weekly / yearly changes in trade price are put up here as illustration.
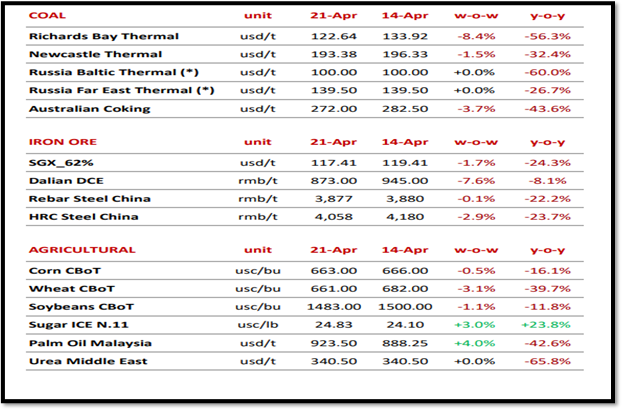
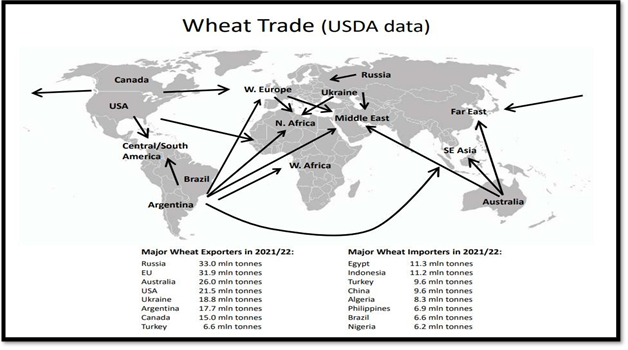
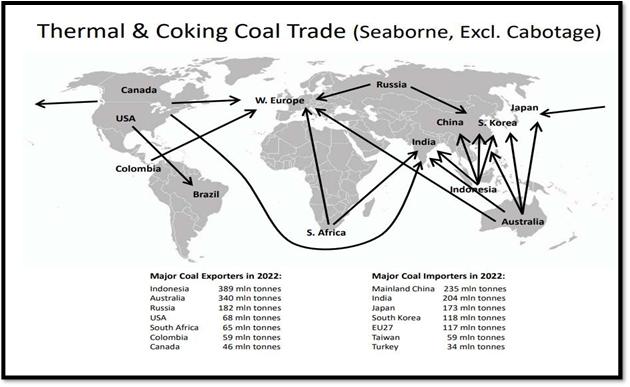
TRADE ROUTE FOR THREE MAJOR DRY BULK CARGOES
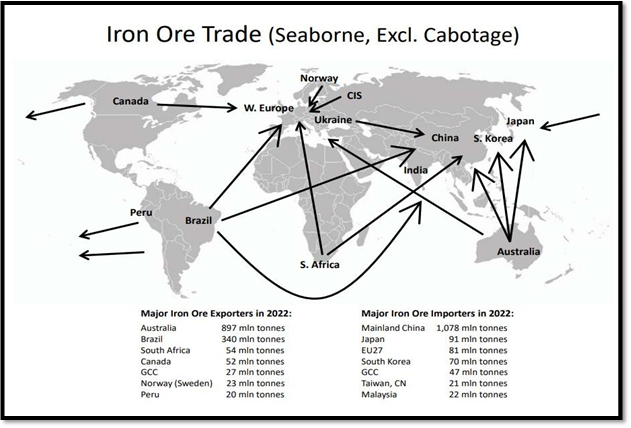
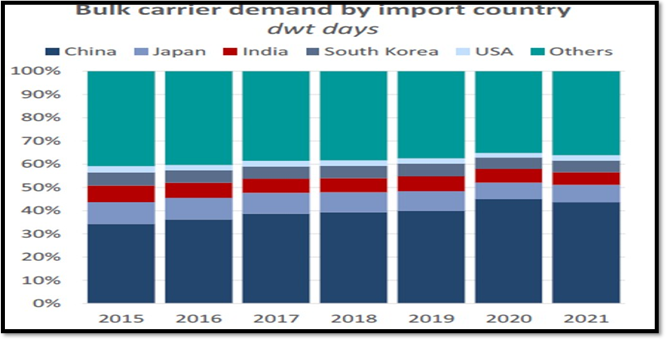
CHINA ACCOUNTS FOR 46 PCT OF IMPORT
SHIPPING MARKET MECHANISM
Sea transport services are provided by four closely related markets, each trading in a different way. The freight market trades in sea transport; the sale and purchase market trades second-hand ships; the newbuilding market trades new ships; and the demolition market deals in ships for scrapping. Beyond this there is no formal structure. For example, ordering ships at the top of the market cycle is usually bad business, but if for some reason few ships are ordered, the rule will not apply. How the four shipping markets integrate Because the same shipowners are trading in all four markets their activities are closely correlated.
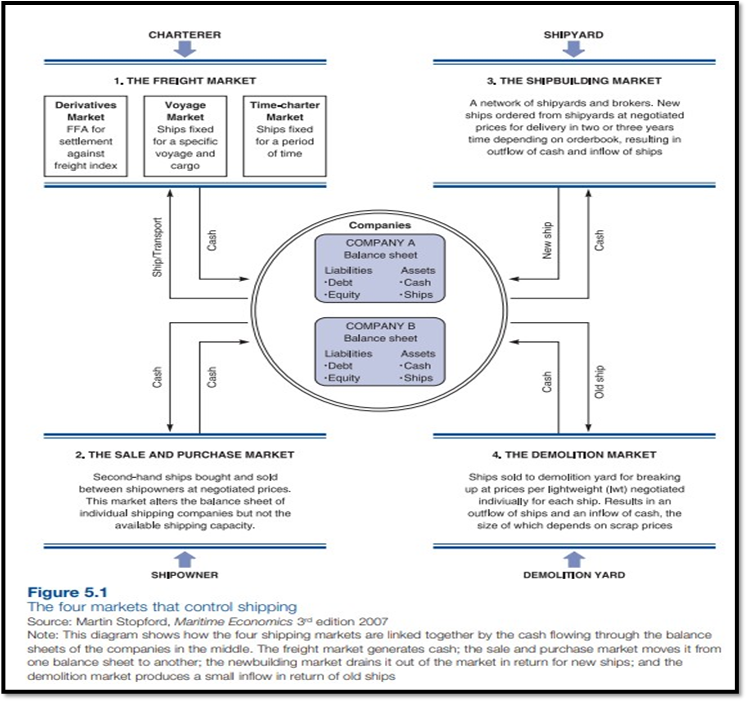
When freight rates rise or fall the changing sentiment ripples through into the sale and purchase market and from there into the newbuilding market, with the balance sheets of the companies trading in the different markets acting as a link. The way this works is illustrated the focal point is the industry balance sheet, shown at the centre of the chart, which is the consolidation of individual
company balance sheets. Cash flows in and out of the balance sheets of the various shipping companies as they trade in the four shipping markets (represented by the squares) which respond to the cycles in trade. The freight market (market 1) provides freight revenue, the main source of cash for shipping companies. In fact, there are three sectors to this market: the voyage market which trades transport for a single voyage; the time-charter market which hires out the ship for a defined period; and the freight derivatives market which deals in forward contracts settled against an index. Freight rates earned in these markets are the primary motivating force driving the activities of shipping investors. The other cash inflow comes from the demolition market (market 4). Old or obsolete vessels sold to scrap dealers provide a useful source of cash, especially during recessions. The sale and purchase market (market 2) has a more subtle role. Investing in a second-hand ship involves a transaction between a shipowner and an investor. Because the investor is usually another shipowner, money changes hands but the transaction does not affect the amount of cash held by the industry. The sale of a bulker for $25 million just transfers $25 million cash from one shipping bank account to another, leaving the aggregate cash balance unchanged.2 In this sense the sale and purchase market is a zero-sum game. For every winner there is a loser. The only real source of wealth is trading cargo in the freight market.3 In the case of the newbuilding market (market 3) cash flows in the opposite direction. Cash spent on new ships flows out of the shipping industry because the shipyard uses it to pay for materials, labour and profit. These waves of cash flowing between the four markets drive the shipping market cycle. At the beginning of the cycle freight rates rise and cash starts to pour in, allowing shipowners to pay higher prices for second-hand ships. As prices are bid up, investors turn to the newbuilding market which now looks better value. With the confidence created by bulging wallets they order many new ships. A couple of years later the ships arrive on the market and the whole process goes into reverse. Falling freight rates squeeze the cash inflow just as investors start paying for their newbuilding. Financially weak owners who cannot meet their day-to-day obligations are forced to sell ships on the second-hand market. This is the point at which the asset play market starts for those shipowners with strong balance sheets. In extreme circumstances, – such as those of 1932 or 1986 or 2008.
For modern ships change hands at bargain prices, though shipowners pursuing the strategy of ‘buying low and selling high’ are often disappointed because in short recessions there are few bargains. For older ships there will be no offers from trading buyers, so hard-pressed owners are obliged to sell for demolition (market 4). As more ships are scrapped the supply falls, freight rates are bid up and the whole process starts again.
Shipping cycles (60 Years vs Modern times)
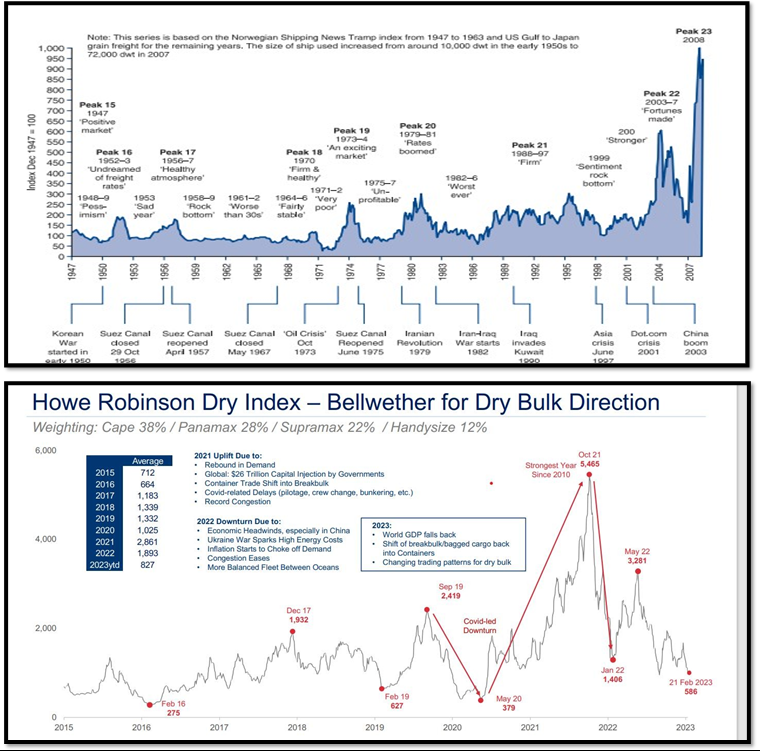
Shipping cycles are crucial part of the market mechanism and five points are highlighted here . First, shipping cycles have different components – long, short and seasonal. Second, the function of the short shipping cycle is to coordinate supply and demand in the shipping market. They are the shipping market’s daily heartbeat and as long as there are fluctuations in supply or demand there will be cycles. Third, a short cycle typically has four stages. A market trough (stage 1) is followed by a recovery (stage 2), leading to a market peak (stage 3), followed by a collapse (stage 4). Fourth, these stages are ‘episodic’, with no firm rules about
the timing of each stage. Regularity is not part of the process. Fifth, there is no simple formula for predicting the ‘shape’ of the next stage, far less the next cycle. Recoveries can stall halfway and slump back into recession in a few months or last for five years. Market collapses may be reversed before they reach the trough. Troughs may last six months or six years. Peaks may last a month or a year. Sometimes the market gets stuck in the middle ground between trough and recession.
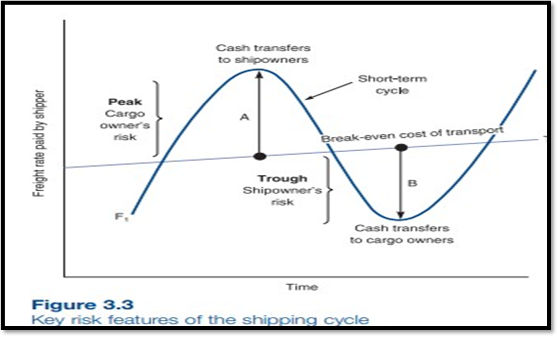
Primary risk takers are the shipowners (the investors who own the equity in the ships offered for hire) and the cargo owners (also called the shippers) who between them perform the balancing act of adjusting supply to demand. They are on opposite sides of the shipping risk distribution, and when supply and demand get out of balance, one or the other loses money. Figure 3.3 shows how movements in freight rates (the vertical axis) over time (the horizontal axis) determine who pays. The breakeven cost of transport is shown by the line T1 – in a perfect market this should reflect the long-term cost curve for operating ships, and if supply and demand were always precisely in balance freight rates would follow this line. But in practice supply and demand are rarely exactly in balance, so freight rates fluctuate around T1, as shown by the short-term cycle F1. When cargo owners get it wrong and have too many cargoes, rates shoot above the trend cost, transferring cash to shipowners who respond by ordering more ships (point A in Figure 3.3). Conversely, when the owners get it wrong and there are too many ships, rates swing below trend. Shipowners find themselves subsidizing the cargo owners and they cut back on investment (point B in Figure 3.3). In this way the cycles exert financial pressure to correct the situation and bring rates back to the trend. Eventually if business is to continue, the freight cashflow should average out at the break-even cost of transport, so across the whole market shipping risk is primarily about the timing of receipts.
It is a shipping and trade index created by the London-based Baltic Exchange. It measures changes in the cost of transporting various raw materials, such as coal and steel.
Members of the exchange directly contact shipping brokers to assess price levels for given shipping paths, a product to transport, and time to delivery or speed. The Baltic Dry Index is a composite of four sub-indices that measure different sizes of dry bulk carriers or merchant ships: Capesize, Panamax, Supramax, and Handymax.
BALTIC DRY INDEX 1985-2022

BALTIC DRY INDEX 2018-2023

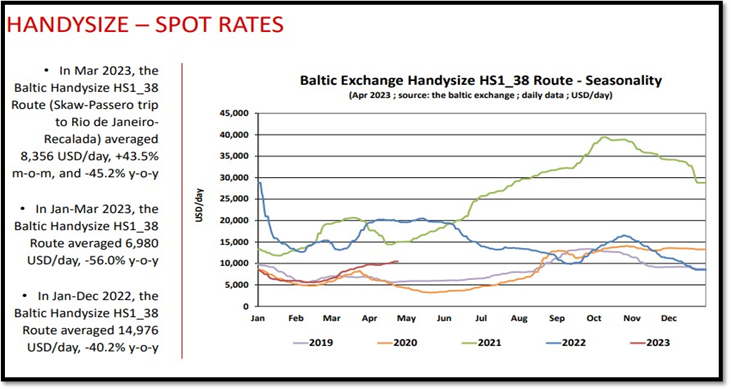
SPOT SHIPPING RATE FOR HANDY VESSEL FOR 5-10 YEARS
SPOT RATE FOR ALL SEGMENTS

TITLE 5 - SHIPPING REGULATORY SYSTEM
International regulatory system and the legal and political issues that have influenced, and in some cases dominated, the maritime scene since the mid-1960s. The idea is to seek answer to three questions: Who regulates shipping and commerce? What do they regulate? How do regulations affect shipping economics? The first step is to identify the regulators more precisely. In an ideal world there would be a supreme legislative body which makes a single set of international laws, with an international court that tries cases and an enforcement agency. Reality does not live up to this ideal, and some experts doubt whether what passes for international law is really ‘law’ at all.2 There is an International Court of Justice, but its rulings on shipping matters ar e purely advisory. Each of the 166 countries with an interest in shipping has its own priorities. Gaining agreement on a body of international law, far less approving an international executive to enforce the laws, is hardly likely to succeed. Maritime regulation is currently organized through the more pragmatic system set out in Figure 16.1. The difficult task of coordinating the many interests and gaining agreement to a consistent body of maritime law falls to the United Nations.
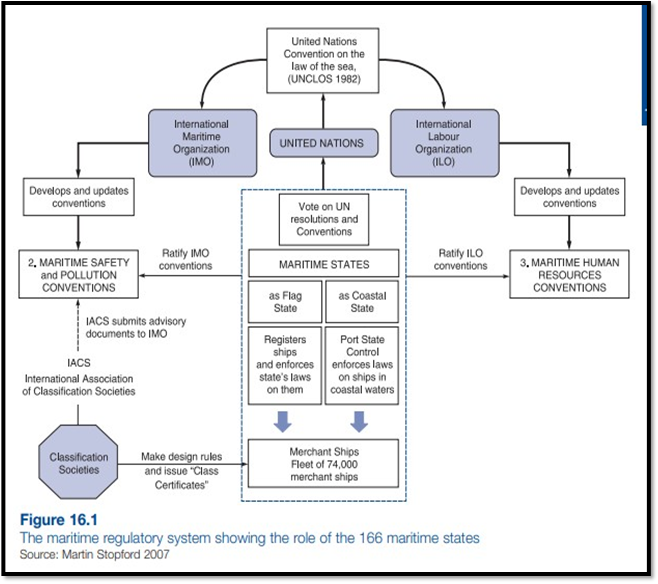
The United Nations Convention on the Law of the Sea (UNCLOS 1982) sets the broad framework, whilst the task of developing and maintaining workable regulations within this framework is delegated to two UN agencies, the IMO and ILO. The IMO is responsible for regulations on ship safely, pollution and security and the ILO is responsible for the laws governing the people on board ships. These two organizations produce ‘conventions’ which become law when they are enacted by each maritime state. The enactment of the maritime conventions is in some cases patchy because not all the 166 states sign up to some conventions, but the major ones such as SOLAS and MARPOL have been made law by every significant flag state. Each maritime state has two different roles, first as a ‘flag state’ and second as a ‘coastal state’ As a ‘flag state’ it makes and enforces laws governing ships registered under its flag. For example, as a flag state Greece is legally responsible for ships flying the Greek flag, wherever they are in the world, whilst as a coastal state it enforces maritime laws on ships in Greek territorial waters. This is known as ‘port state control’. Generally, the laws maritime states enforce comply with maritime conventions, but not always. For example, when the USA passed the Oil Pollution Act (1990), a law designed to phase out single-hull tankers in US waters, there was no maritime convention on this issue. The other major ‘players’ in the regulatory process are the classification societies. Most major maritime nations have their own classification society, and they are, in effect, the technical advisers to the maritime regulators. Over the last decade their role as recognized organizations (ROs) has increased and they assist the regulators in making and implementing maritime laws with a technical, human or environmental focus. In addition, they develop technical standards in their own right and award the classification certificate which is required by insurance underwriters. They are paid for these services but have no legal powers of enforcement beyond withdrawing their services.
The regulatory system discussed in this involves six principal participants in the regulatory process: ● The classification societies: the shipping industry’s own system for regulating the technical and operational standard of ships. The classification societies make rules for ship construction and maintenance and issue a classification certificate to reflect compliance. ● The United Nations, which sets the broad framework of maritime law. ● The flag states. The primary legal authority governing the activities of merchant ships is the state in which the ship is registered, the flag state. By custom this state is responsible for regulating all aspects of the commercial and operational performance of the ship. International laws are developed by the participation of flag states in treaties or conventions. ● The coastal states. A ship is also subject to the laws of the coastal state in whose waters it is trading. The extent of each state’s territorial waters and the scope of regulation vary from one country to another. ● The IMO, the UN agency responsible for safety, the environment and security. ● The ILO, responsible for regulations governing people on board ship. In the following sections we will consider each of these regulatory regimes
International Convention for the Prevention of Pollution from Ships This convention, knowns as MARPOL, is the main international convention covering the prevention and minimization of pollution of the marine environment by ships from operational or accidental causes. It is a combination of two treaties adopted in 1973 and 1978 and updated by amendments through the years. It currently has six technical annexes which set out the detail of the regulations: Annex I: Regulations for the Prevention of Pollution by Oil Annex II: Regulations for the Control of Pollution by Noxious Liquid Substances in Bulk, including a list of 250 regulated substances Annex III: Prevention of Pollution by Harmful Substances Carried by Sea in Packaged Form (shipped in drums, etc.) Annex IV: Prevention of Pollution by Sewage from Ships Annex V: Prevention of Pollution by Garbage from Ships Annex VI: Prevention of Air Pollution from Ships
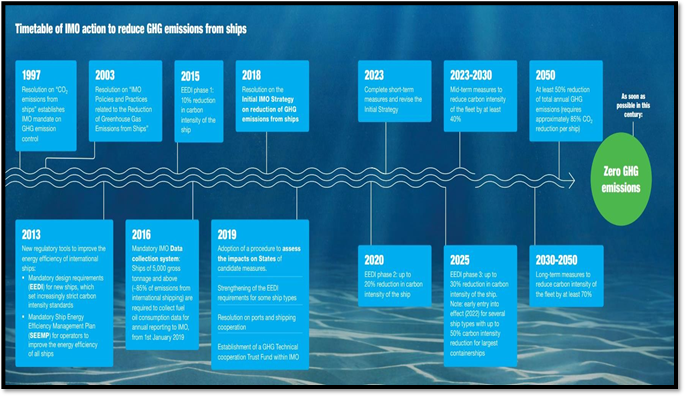
MARPOL convention is wanting to dramatically alter shipping pollution by bringing down environmental pollutants like sulpher and cabon dioxide emanated from use of various fuel in ship .Shipping contributes total 3 pct of global pollution and in 2020 Bunker fuel sulpher usage was restricted which led to usage of low sulpher fuel oil . IMO through MARPOL is now turning to lower greenhouse emission as per details below.
As global decarbonisation movement picks up, there is pressure from regulator, shipper , charterers , financiers ( Bank ) to implement Decarbonisation goals . This is in line with general trend in other industries.
IMO environmental regulations, which cover issues such as air pollution, ballast water treatment and double hulling of tankers, have continued to influence decisions on the design and construction of ships.2 On 1st January 2023, three new IMO regulations come into force – aiming to reduce maritime carbon emissions and the environmental impact of shipping. These are: 1. The Energy Efficiency Existing Ship Index (EEXI) – This is a framework for determining the energy efficiency of vessels over 400 GT. Ship operators will have to assess their ships’ energy consumption and CO2 emissions against specific energy efficiency requirements. To ensure compliance, ship owners may need to reduce their vessels’ emissions. This is a one-time certification.
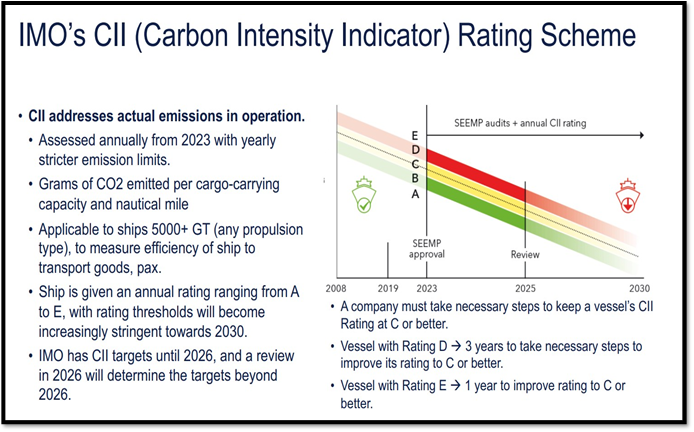
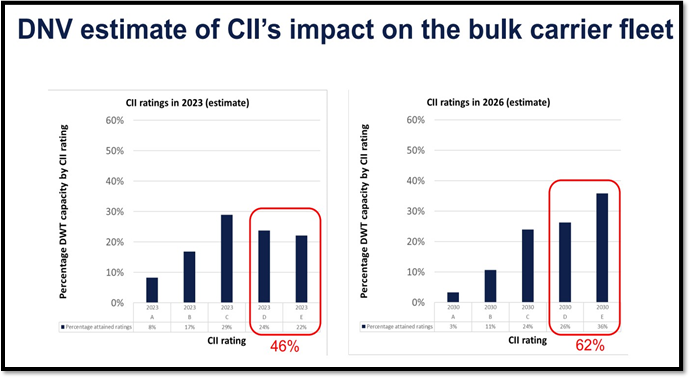
2. The annual operational Carbon Intensity Indicator (CII) – The CII, which applies to ships of 5,000 GT and above, indicates a vessel’s performance and efficiency based on annual fuel consumption, using a rating from A to E. The CII will be assessed annually from 2023 and becoming increasingly stringent towards 2030. For ships that achieve a D rating for three consecutive years, or an E rating in a single year, shipowners need to develop a corrective action plan. 3. The enhanced Ship Energy Efficiency Management Plan (SEEMP) – The SEEMP is the mechanism for improving CII ratings. It envisages targets and planning, and the new technologies and practices for optimizing ship performance, along with procedures for self-evaluation, verification and company audits. Governments are pressing to strengthen IMO regulation. The United States and Norway, for example, have jointly announced a Green Shipping Challenge for COP27 and have called on the IMO to adopt a revised greenhouse gas strategy, setting an interim goal for 2030 and zero emissions no later than 2050. Shipping is also affected by other national and regional environmental policies. The EU, for example in 2021 presented a ‘Fit-for-55’ package, which charts the path towards 2050 to decarbonize across various sectors, including shipping, and includes changes to the EU Emissions Trading Scheme (ETS). In shipping, the package covers bunkering infrastructure in ports, with related tax incentives, and aims to promote alternative fuels, establishing fuel standards and lifecycle GHG footprint requirements. The EU Commission foresees a cap-and-trade system that limits GHG emissions for each ship with a mechanism for trading in a secondary market.3 Revenues generated from the auctioning of maritime allowances would go into a fund to support investments in energy transition. Companies would have to buy carbon credits for all voyages starting or ending in the EU, and when at berth in EU ports, whichever flag they fly, or wherever the owner of that ship is. The regulation would apply to all ships above 5,000 GT, though there are discussions for lowering the threshold. Ships that do not comply could be detained or denied entry to ports.4 This is likely to increase the cost of voyages involving EU ports.5 At the beginning of 2018, emissions allowances were being traded on the EU ETS at €8 per ton of CO2 equivalent, but by March 2022 the price had risen to €80 to €90 per ton and is expected to rise further and become increasingly volatile.
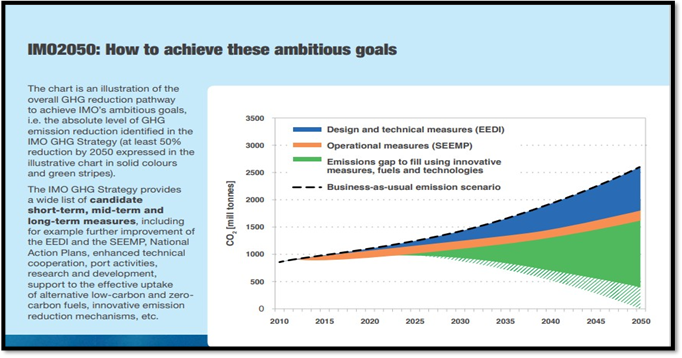
CII – An Illustration
It is an important part of the IMO goal of decarbonization and there is lot of works going on . However it comes with its own set of challenges.
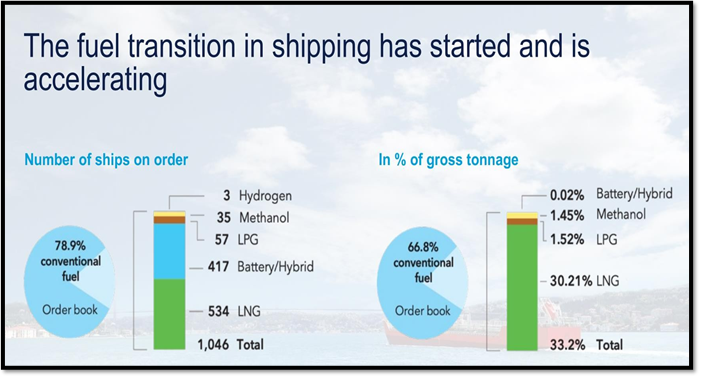
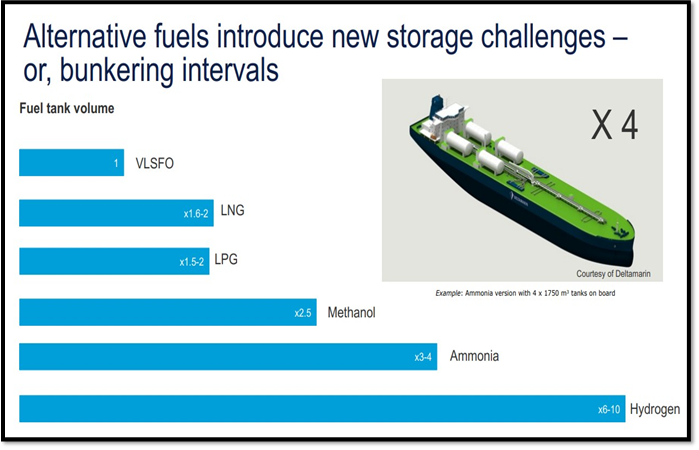
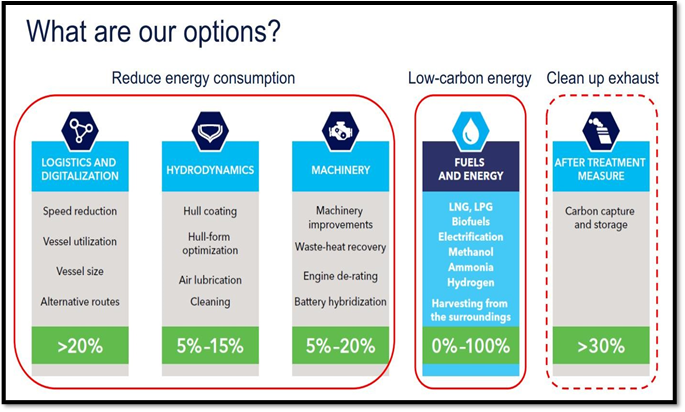
OTHER MEANS / OPTIONS FOR REDUCING CARBON
EMISSION INCLUDING FUEL TRANSITION
TITLE 7 - WAY FORWARD
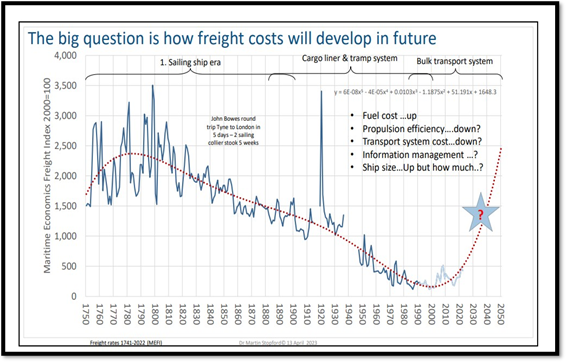
A. FUTURE OF DRY BULK FREIGHT COST – WILL IT GO DOWN AS PER PAST TREND
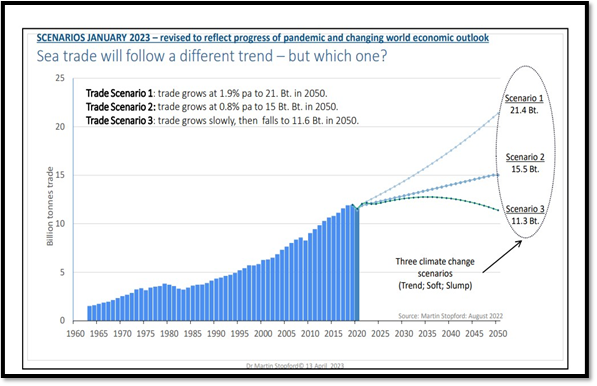
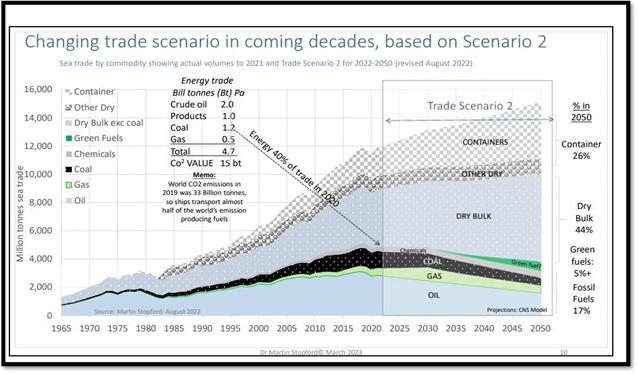
B. FUTURE OF MARITIME TRADE GROWTH – VARIOUS SCENARIOS
C. TRADING MIX FOR DRY BULK PRODUCT – WILL IT CHANGE ?
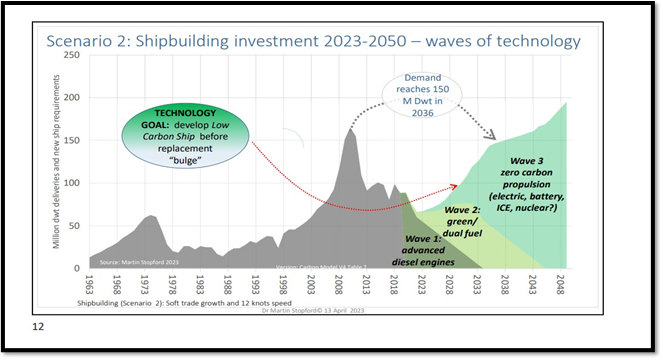
D. FUTURE OF SHIPBUILDING – HOW IT MAY BE IMPACTED BY ZERO CARBONISATION PATHWAY
Since dry bulk shipping is dependent on trade of few countries, any change in economic growth ( particularly China ) will have an effective impact on dry bulk . Geopolitical tension / Global pandemic / climate effect etc can become black swan events in future . But maritime trade has traversed this kind of uncertainties in past and have seen continuous growth in global economics in spite of multiple challenges .Shipping as always will be part of human’s growth story.
1. UNCTAD REVIEW OF MARITIME TRANSPORT 2022
2. MARITIME ECONOMICS – DR MARTIN STOPFORD
3. FUTURE PERSPECTIVE ON SHIPPING AND TRADE – DR MARTIN STOPFORD – SHIPPING & OFFSHORE NETWORK, OSLO , NORWAY
4. A YEAR OF SWINGING FORTUNES – JACOB WALENKIEWICZ, DNV SHIPPING AND OFFSHORE NETWORK
5. WORLD ECONOMIC OUTLOOK – IMF
6. WIKIPEDIA ON BULK CARRIER
7. CLARKSONS RESEARCH
8. BANCOSTA DRY BULK MARKET OUTLOOK MARCH 2023
9. IFCHOR DRY BULK RESEARCH
10. PRESENTATION ON COASTAL TRADE BY ISL DUBAI
11. EMERGING SHIP FUELS – IS THE TRANSITION HAPPENING FAST ENOUGH – DNV