


Bookshelf
Power auditing – a systematic approach to reducing electrical energy consumption
Lawrie Evans, Managing Director, EmCem Ltd, United Kingdom
Cement manufacture is by nature a highly energy intensive process. As control of energy sources, generation, distribution and consumption of energy is central to many current world issues, knowledge and improvement of the cement industry’s energy footprint is a matter of intense interest to governments. This is recognised in such initiatives as ISO 50001, the World Business Council for Sustainable Development's CSI, Energy Star in the USA, PAT in India and CO2 taxes / trading in Europe and other countries.
Electrical power consumption usually accounts for between 25 and 40% of the cost of producing cement, depending on the specific power consumption and the local cost of power. In most countries, there are few, if any, options to negotiate power cost and opportunities normally exist only to discuss on- and off-peak power periods and discounts for accepting interruptible power at times when power generation capacity / grid overloads may be a problem for the power companies.
The high contribution to costs should make power an area where a large proportion of management and engineering effort is concentrated, but it remains a key performance indicator which is more difficult to analyse than, for example, fuel consumption or kiln specific production, and stays as a peripheral issue for many plant operations.
One further issue is that of the total power consumption per ton of cement, up to 50% of the power used is in raw and cement grinding operations (mill drive only), an area which remains difficult to analyse and target, when frequently little is known about the hardness of the current raw materials and especially when producing a large variety of cements with diverse additions and a variable clinker grindability. In comparison with fuel consumption it is a broad observation that any study which compares power consumption between cement plants has a far wider range of variation than fuel consumption. Whilst some of this can be explained by obvious differences in raw material hardness, raw and cement milling systems used, surface area of the finished cements and cement to clinker ratio, in practice there are usually many more economically attractive opportunities to improve power consumption on a plant than fuel consumption.
The ISO 50001 Energy Management System framework has been introduced to recognise the global importance of energy consumption. The overall standard includes both fuel and power, but it is the methodology to be followed which is of major importance to the cement industry. A summary of the overall framework is shown in Figure 1, which establishes a minimum of three significant steps to be followed which are
· Establish an energy policy
· have a systematic framework for improvement
· have a systematic feedback of results leading to a continuous improvement process.

Figure 1 : ISO 50001 Overall Framework
The breakdown of the overall framework for improvement is shown in Figure 2, where the principle of PDCA (Plan, Do, Check, Act) is the central theme. The section numbers in the figure are the essential organisational details and methodologies needed to meet ISO 50001 requirements. One of the most important first steps is to select and appoint an individual or team to have energy management as their prime responsibility.

Figure 2 : ISO 50001 Detailed Organisation of Improvement Cycle
Although it is not formally part of ISO 50001, it is generally accepted that benchmarking and targeting are very much part of the process. Knowing your ultimate objective is essential for gauging success and encouraging the team to work towards that objective. Figure 3 is an example of a simple overall power consumption benchmark for a solid fuel fired precalciner kiln with a vertical mill for raw material grinding. The overall benchmark / target is 59kWh/t clinker, which is then broken down into process sections for a better initial appreciation of targets. This approach can also be extended to other operations such as cement grinding, packing and loading, plant services, etc.

Figure 3 : Typical Benchmark Breakdown for Power Consumption to Clinker
All of the above act as a necessary precursor to full analysis of plant performance “As Is“ and before any improvement targets are defined. A typical first step is to make an overall breakdown of the plant into major sections, i.e.
· Power to clinker – taken as from raw material reception into crushers, etc., up to clinker into storage silos
· Cement grinding - extraction from clinker silos to cement into silos
· Packing and Loading - extraction from cement silos to despatch from plant
· Services - including plant air compressors, general water pumping (including quarry), lighting.
A consistent and organised breakdown of the allocation of meter readings on the plant into these sections is essential for accurate reporting.
The next area for preliminary review relates to the power supply contract and the alternative options and opportunities that exist around it. Usually, billing is divided into two main areas: a demand charge related to the peak power absorbed over a month and a consumption charge, related to actual power consumed in the month. It is important to know the exact conditions which apply to both demand and consumption charges in any off-peak or peak periods. Opportunities which may exist include acceptance of power interruptions at peak hours in return for reduced charges, moving to a higher voltage supply, albeit probably with associated capital cost, and reducing demand charges by improving incoming power factor.
It is good practice to make an overall check to ensure that readings from the incoming power meter, which are the basis for invoices, correspond to those of the main incoming plant-owned meters. It is not unusual to find discrepancies, and resolution of such issues with the power company is often protracted. It is also essential to have an updated single line diagram for the plant with all the associated metering clearly defined.
Finally, with the normal monthly power meter reading system in place and the methodology for allocating power and tracking power consumption decided, the basic platform for power auditing is in place.
The start point for power auditing is to have a complete list of all installed motors / drives. List of the data items which could be included per motor is:
- motor manufacturer;
- kW specified;
- Volts;
- Amps;
- RPM;
- Cosf;
- efficiency class;
- rewinds;
- duty specification;
- expected annual operatin hours.
The start point for measurement depends on the power metering already in place. Most modern plants already have a SCADA system (Figure 4) which can perform data logging on at least the major drives. Outside of this, the main audit tool required is a power logging / analysis tool of a type available from several major suppliers. Optionally, thermal imaging of the individual motors could be added to help identify low efficiency, especially for rewound motors.

Figure 4 : Typical SCADA Layout
The next step is to decide which motors to measure individually. On a typical cement plant with drives numbering in the thousands, it is too time consuming and of low value to measure all. Usually a cut-point of greater than 50kW installed is selected, although there may be exceptions.
In order to ensure that all the data for the audit is collated correctly, a detailed spreadsheet of the motors to be measured, their rated powers etc. is essential. This should include space for rated process information (where available) and the actual process data measured during the audit.
In parallel with the power audit, it is essential to conduct a series of process measurements of actual flows and pressures (where appropriate, also oxygen contents), at least in the main process areas and preferably including compressors and main water pumps, etc. To be fully useful power auditing should be carried out only when the main equipment is running smoothly at, or close to, normal operational regime.
For the on-plant testing itself, the most important issue is safety: it is obviously essential to have fully qualified engineers / technicians working on all live electrical testing.
It is desirable to include a grinding audit with mill inspections and sampling of raw materials, clinker and additions for grindability testing and to enable targeting the power consumption of the mills. Considering the overall importance of this factor, with up to 50% of the total power consumption per ton of cement is used in raw and cement grinding operations (mill drives only), it is surprising that plants rarely have up to date laboratory test data for grindability. Even with this data, milling remains an area which is difficult to analyse and target, especially when producing a large variety of cements with diverse additions and a variable clinker grindability.
One other measurement that is also valuable to have available is a record of power consumed in a process area during run-up and run-down periods before and after the main process equipment is in normal production. If the plant has a SCADA system this will be simple, but logging tools and on site metering can also be used.
Having obtained all the on-site data required (Figure 5 shows a short example version of this for a fan), analysis can proceed. In the majority of cases, there are known equations relating operating data for process equipment to the expected power drawn. Figure 6 gives a simple example for a bucket elevator. Obviously there needs to be some allowance for minor errors in results, as gas flows, pressure measurements and material flows will not be exact, but areas where performance is poor can quickly be identified. Motors which are operating well below their specified rating and which are therefore inefficient can also be identified. Inleaking air, and the impact on power consumption of process fans, can also be calculated. Fans which are operating with dampers less than 70% open are usually cases where a variable speed control can be employed with good payback. There may even be cases where a variable fan speed control is actually costing power, especially where DC drives are employed and the fan normally operates at or close to maximum speed, but this is often difficult to interpret from normal audit data alone. There may also be cases where hydraulic drives could be substituted with modern variable frequency controls.

Figure 5 : Typical Results for a Power Audit – Case for variable speed on cooler fan

Figure 6 : Bucket Elevator Power Requirement - Approximation
There are many case studies which result from well executed power audits. Four examples are included to give a flavour of the results and actions:
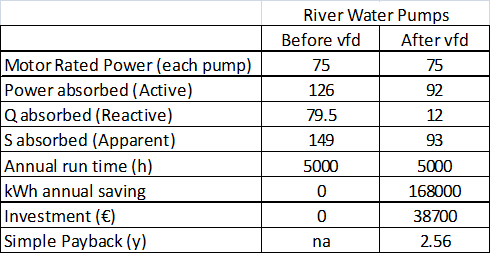
· Table 1 shows analysis and results for retrofit of a variable speed drive to a water pumping system
Table 1 CASE STUDIES : Plant Water Pumping
· Figure 7
gives the results of a power audit / process analysis showing a high pressure drop through a conditioning tower and the calculated impact on preheater fan power consumption

Figure 7 : CASE STUDIES : Conditioning Tower Pressure Drop
· Figure 8 shows the analysis and recommendation made for a cooler exhaust system on a long dry kiln

Figure 8 : CASE STUDIES : Cooler Exhaust System
· Case study shows the impact of measurement of compressed air usage on a bag filter due to be replaced and the resultant decision to specify a low (2 bar) pressure cleaning system on the new bag filter plus an independent compressor.
- For the upgrading of a bag filter 2 main suppliers were under consideration
- Supplier 1 was requiring a plant air supply of 1300m3/h at 7 bar.
- Supplier 2 was offering a separate compressor rated 850 m3/h at 2 bar
- The difference in power required for compressed air 78kW
- In the high energy cost environment of this plant the additional cost of air for Supplier was equivalent to 96k€/y
- This was a major factor in the supplier selection process
Compressed air systems can be a study in themselves, often conducted by specialist companies. Leaks, pressure drops across lines and usage of compressed air for cooling bearings etc. are all areas for scrutiny. Installation of on-line monitoring equipment on branches of compressed air lines can quickly detect changes in demand in the system. Modern servo systems can also substitute for leak-prone valves etc. driven by compressed air, with power savings. An area which can also offer power savings is the effective use of control loops, as operating a plant with good stability reduces power consumption. A study of the main control loops which should be in place and operating effectively on a modern cement plant can quickly reveal issues. A typical example in a recent power audit discovered that all six axial cooling fans were operating in manual control at full speed on a cooler exhaust air-to-air heat exchanger. The resultant inlet temperature to the bag filter was 104°C even though the bags could accept up to 220°C.
Optimising the usage of on- and off-peak power rates is not specifically aimed at saving power, but has a very beneficial effect on its overall cost. Managing this area is not simple, as plans made assuming equipment to be 100% reliable can often be disturbed by unforeseen breakdowns, low specific production, etc. It is feasible to determine the optimum running times of the main process equipment to take advantage of off-peak costs and then evaluate the success factor achieved during each month. Figure 9 is an example of a plant where, by accepting a slight increase in the on-peak maximum demand and improving the scheduling of mill down-time, it was possible to reduce overall plant power costs by 3%.

Figure 9 : Example of Successful Modification of Maximum Demand Profile
Although not strictly part of a power audit, the impact of plant reliability on the overall power consumption cannot be ignored. A typical case for kiln reliability has been studied. For a precalciner kiln the overall impact of good (50 Kiln stops per year) versus bad (140 Kiln stops per year) reliability has been evaluated as between 3.2 and 4.4kWh/t of clinker, depending on the operator’s discipline at minimising power usage during a kiln stoppage. It can be a very useful tool to measure the overall power consumption of the kiln system, for example, in the period after a stop (raw feed off) is recorded and through to the feed restart and up to full feed again. This can then be used to quantify efficiency losses due to reliability issues. Similar tests can be conducted for raw and cement mill systems to evaluate the impact of reliability in these process areas.
The power audit can frequently produce information which can be used in a broader sense to identify projects which can save power by capital investment to change the configuration of a process area. This will require a more expansive view of the operations rather than a relatively simple interpretation of the audit results. As examples
· Figures 13a and b show the potential saving to be achieved by the re-arrangement of a cement mill ventilation system from mill ventilation through the 3rd generation separator to a separate mill ventilation system

Figure 13a Original single fan system. Power consumed by fan 400kW

Figure 13b Revised separate filters arrangement. Power consumed by fans 180kW. Saving equivalent to approx 3kWh/t cement
· Figures 14a and b show the saving to be achieved by the installation of a new preheater fan into a system where a cold air bleed was being used to cool preheater exhaust gases passing into a bag filter. This was in an area where water for conditioning was scarce and preheater gases do not pass to the raw mill system.

Figure 14a Original single fan system. Power consumed by fan 4200kW

Figure 14b Re-configured 2 fan system. Power consumed by fans 2585kW. Saving equivalent to 11.5kWh/t clinker
Overall, there are many opportunities to reduce power consumption costs, but the work required is more complex and diverse than encountered with, for example, kiln fuel consumption. Organising a team and system around the principles embodied in the ISO 50001 standard can lead to very significant savings in energy consumption and costs. Well conducted power audits are an essential tool on cement plants and together with the efficient implementation of the ideas emerging from the audit great success can be achieved in power consumption control and improvement.